Data Visualization
Client: Erie VA Medical Center
Role: Designer
Deliverable: Fiscal Year (FY) 2024 Annual Report Data Visualization
Overview
The FY24 Annual Report for the Erie VA Medical Center required a design system that could translate extensive departmental data into clear, engaging visuals. My focus was on transforming complex statistics, charts, and narratives into an accessible visual experience that clearly highlighted the organization’s yearly achievements.
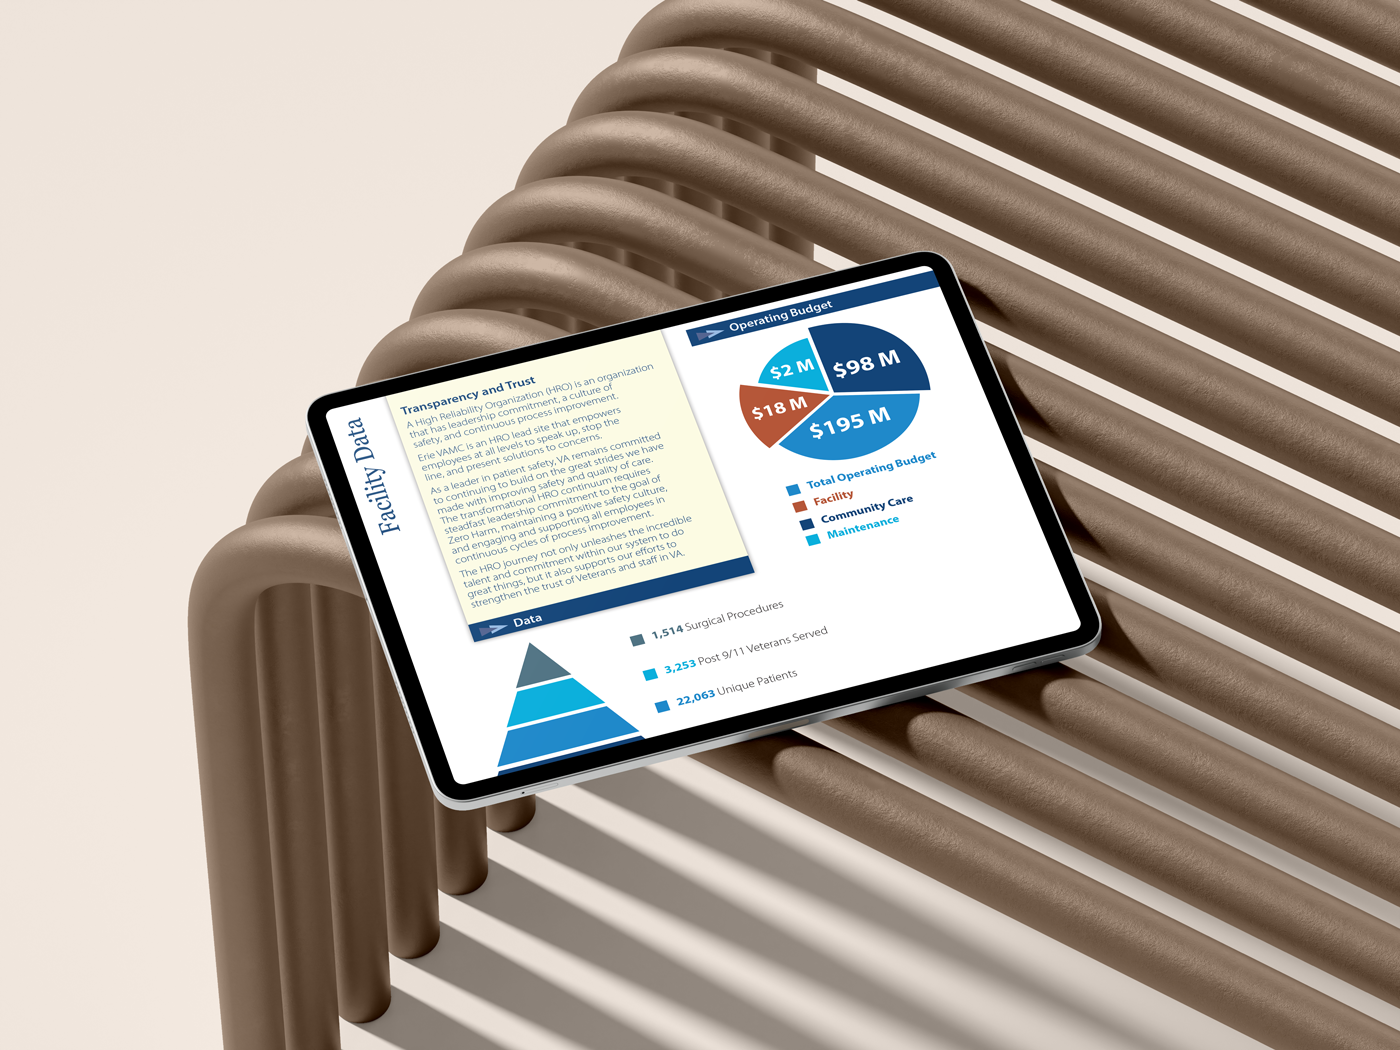
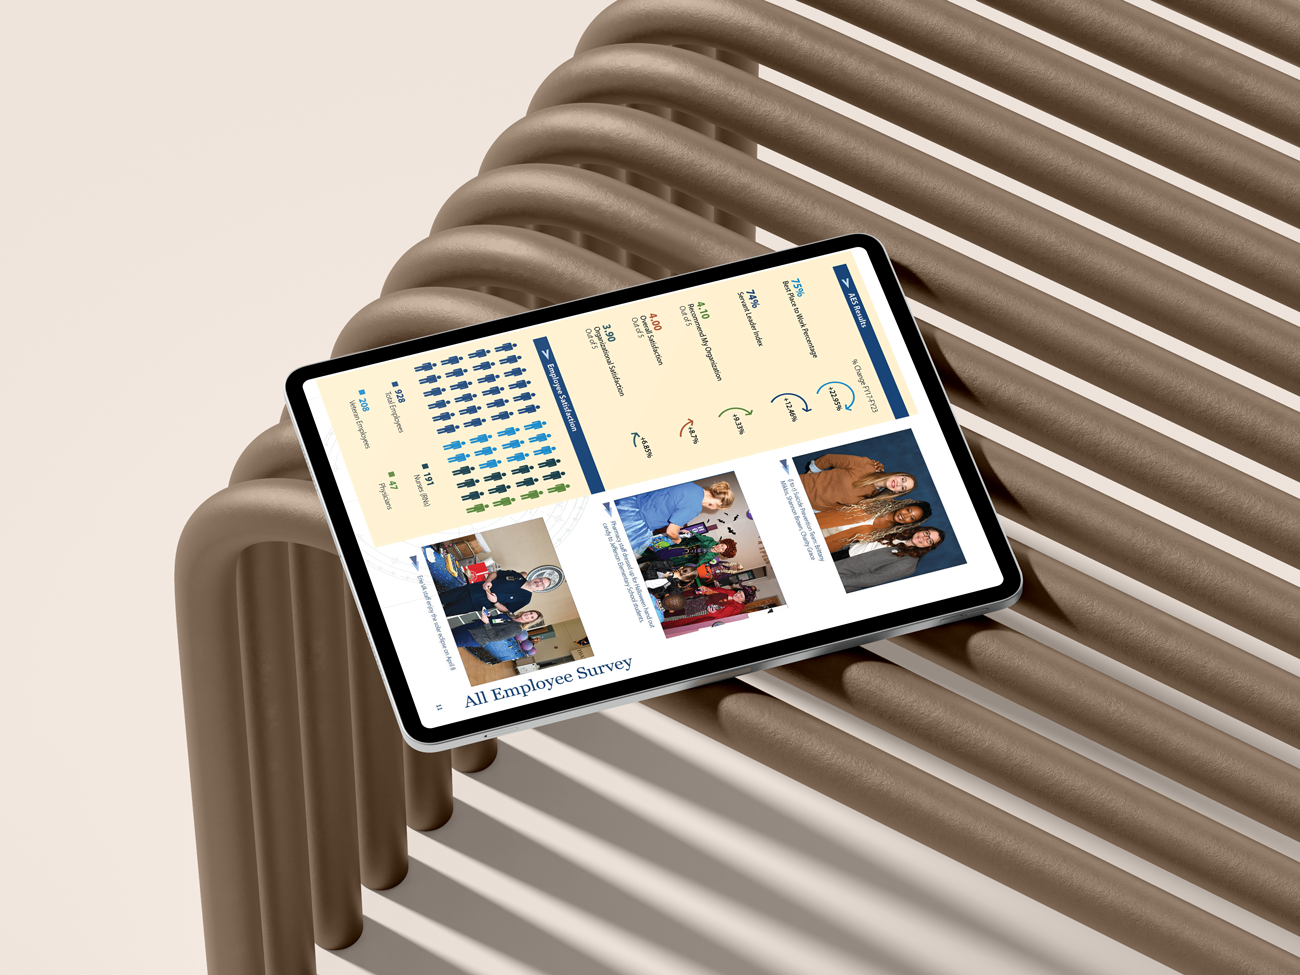
Sample spread from FY24 Annual Report – integrating infographics within editorial layout.
My Role
Designed all infographics, charts, and data diagrams for the FY24 report.
Simplified multi-department data into cohesive visual narratives.
Developed a clear visual hierarchy and color-coding system to categorize key metrics.
Selected typography optimized for readability in both print and digital formats.
Collaborated with report editors to ensure accuracy, consistency, and clarity across all sections.
Design Approach
To simplify data, I began by reviewing each department’s reporting structure and identifying the essential metrics to visualize. I established a hierarchy system that prioritized high-impact statistics and ensured the report remains accessible for a wide audience.
Key considerations included:
Ensuring accessibility through contrast, color, and legible typography.
Maintaining visual consistency across charts, diagrams, and tables.
Structuring information flow to guide readers through each section logically and visually.
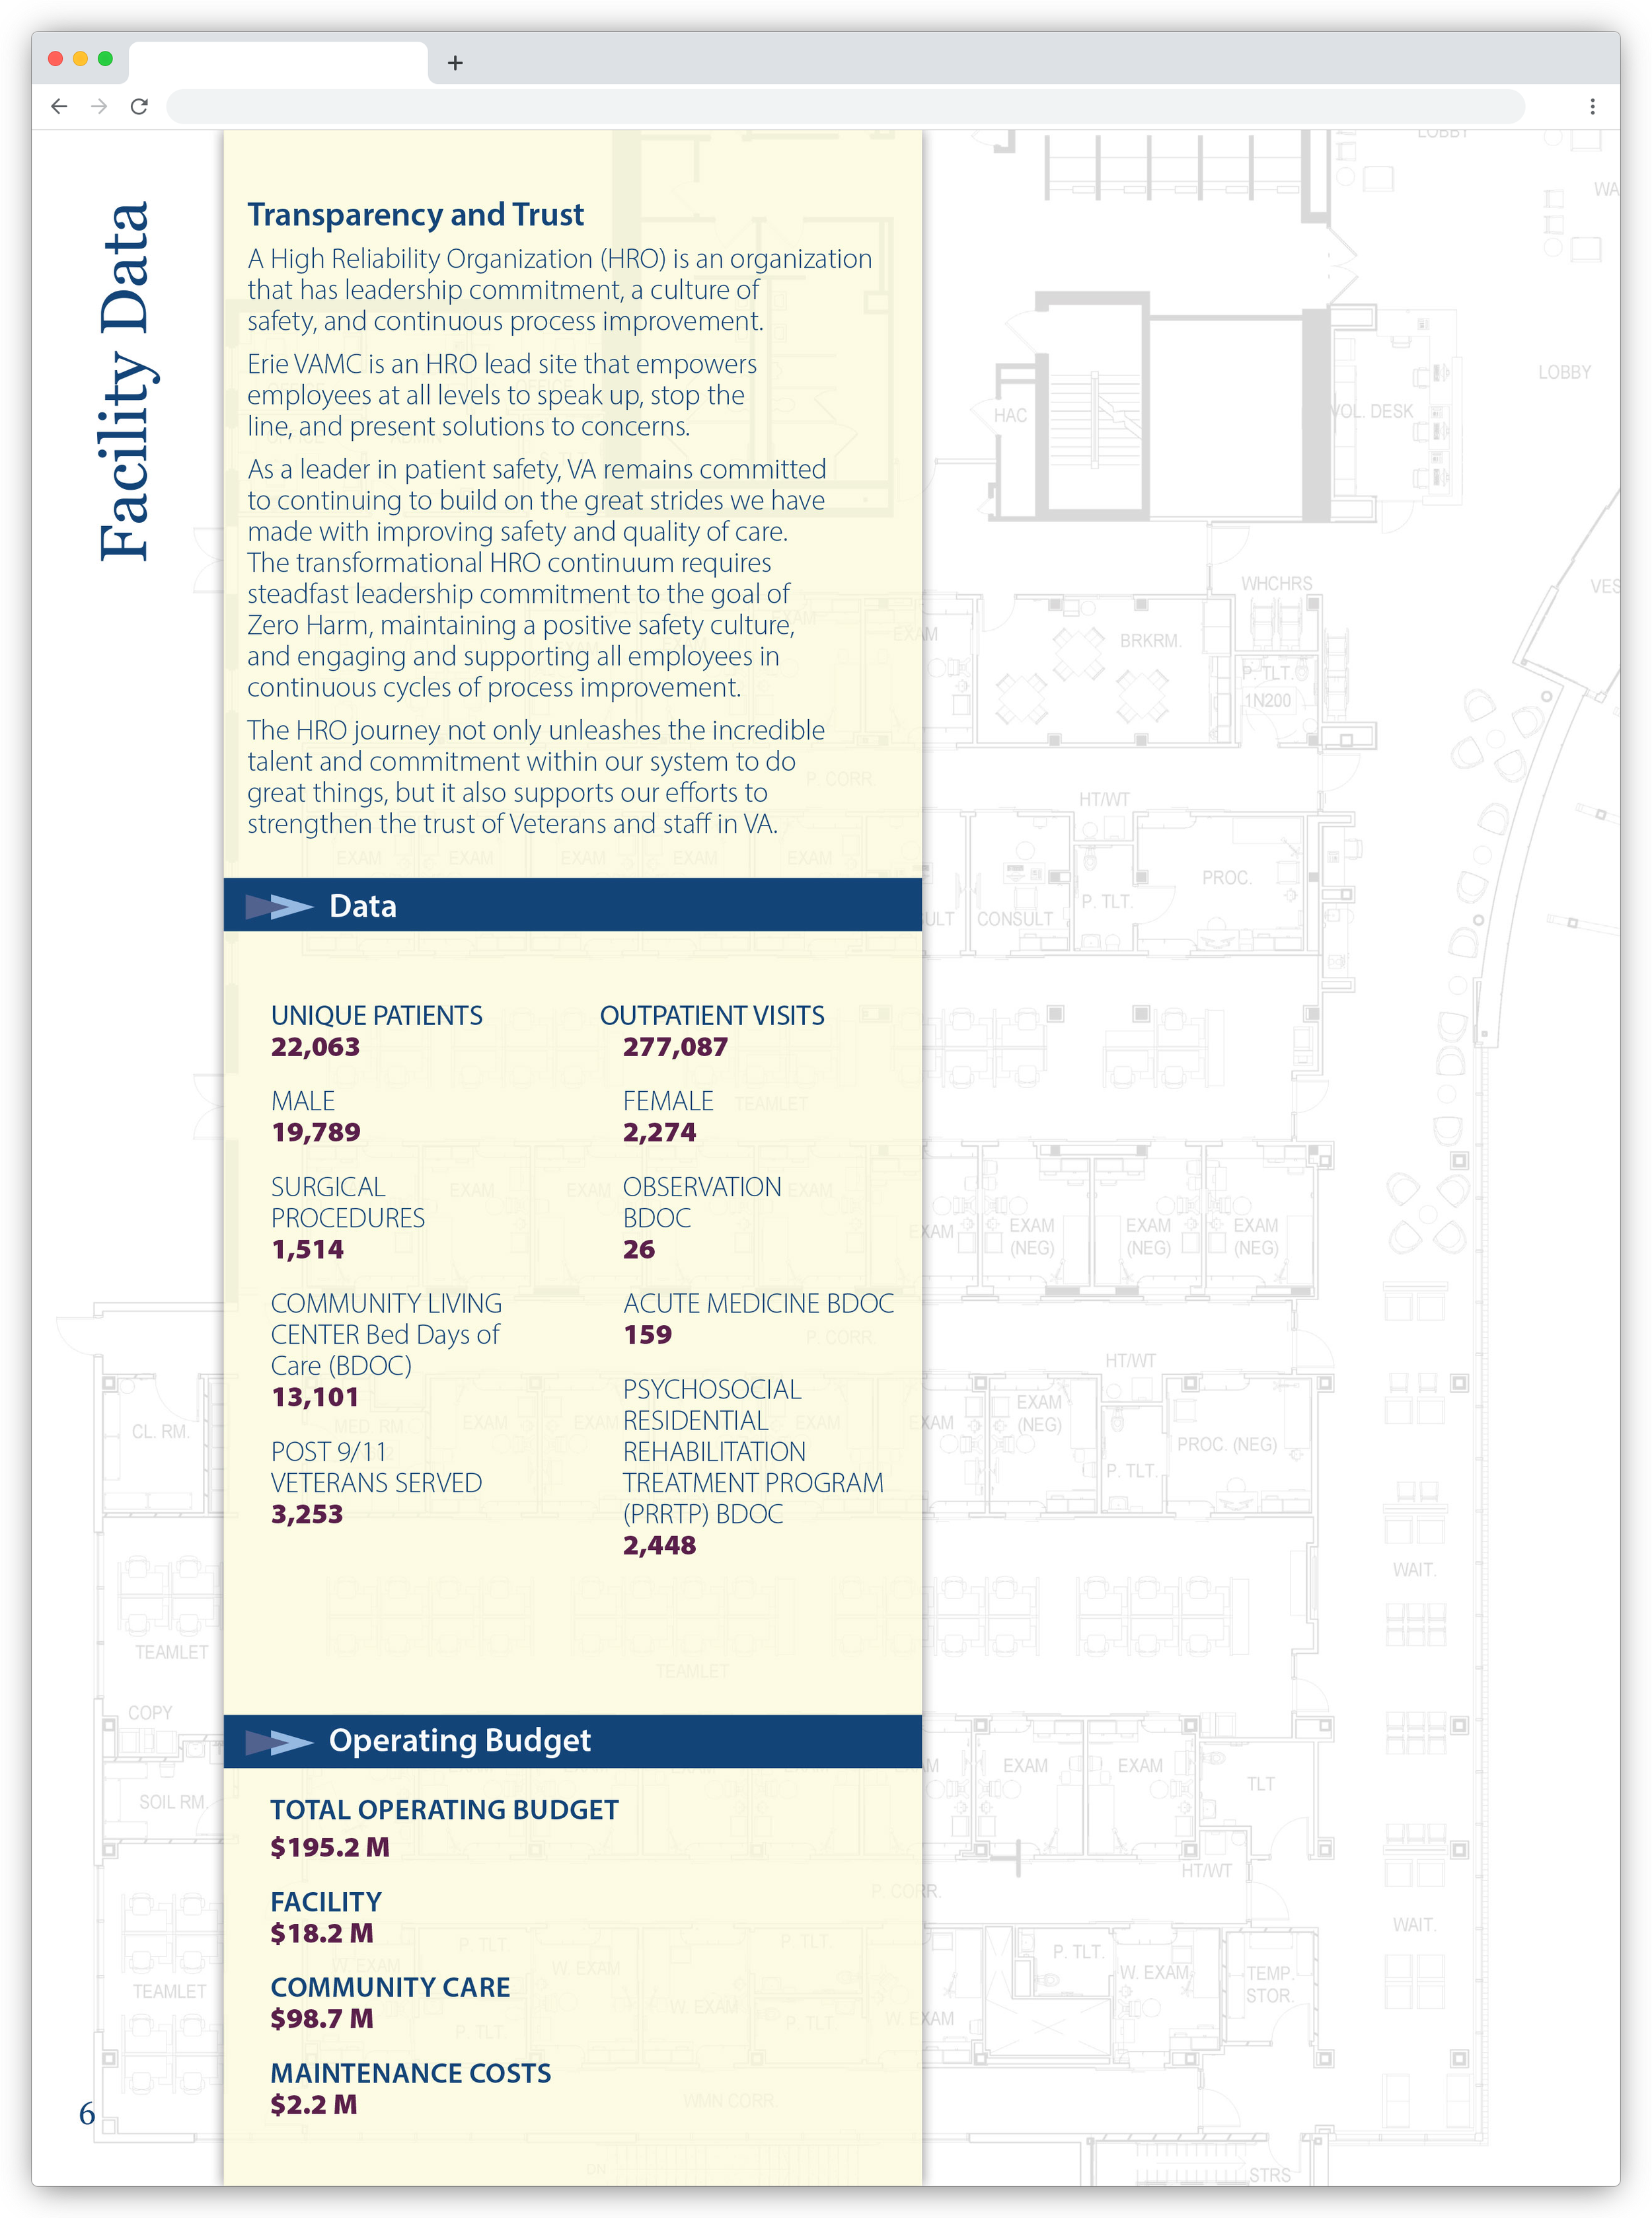
Before
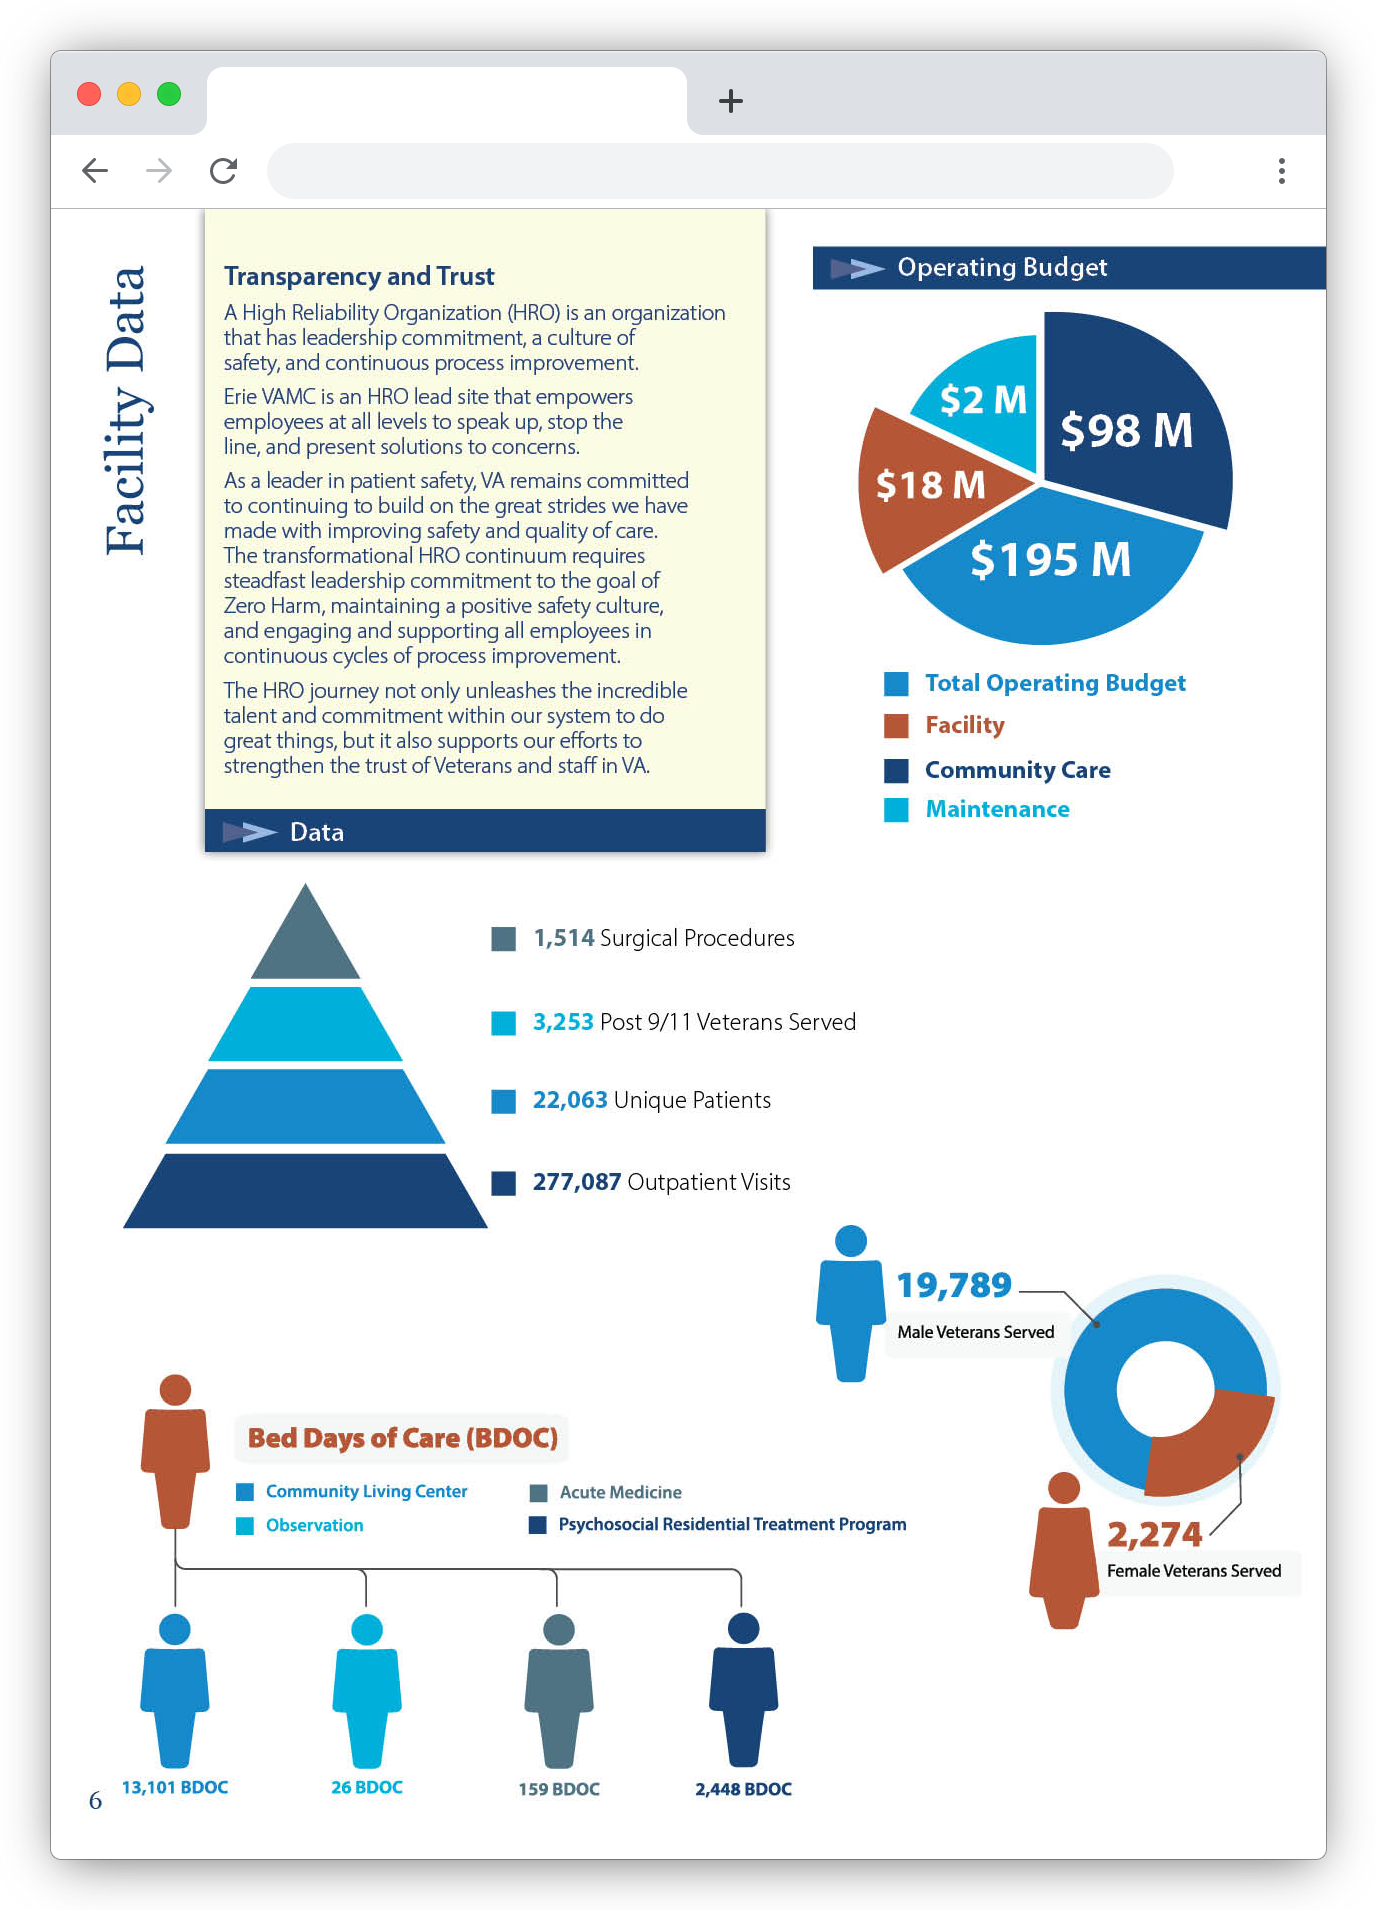
After
Process
Information Mapping – Organized datasets from various departments to identify narrative themes and key performance metrics.
Data Visualization Design – Chose appropriate chart types based on data meaning and comparison needs.
Typography Selection – Chose a brand-aligned sans-serif font family for clarity and legibility, pairing weights to differentiate headers, metrics, and supporting details.
Color Palette – Designed a high-contrast palette ensuring accessibility and visual grouping of related data categories.
Refinement – Conducted multiple review rounds to verify data accuracy and visual balance before final production.
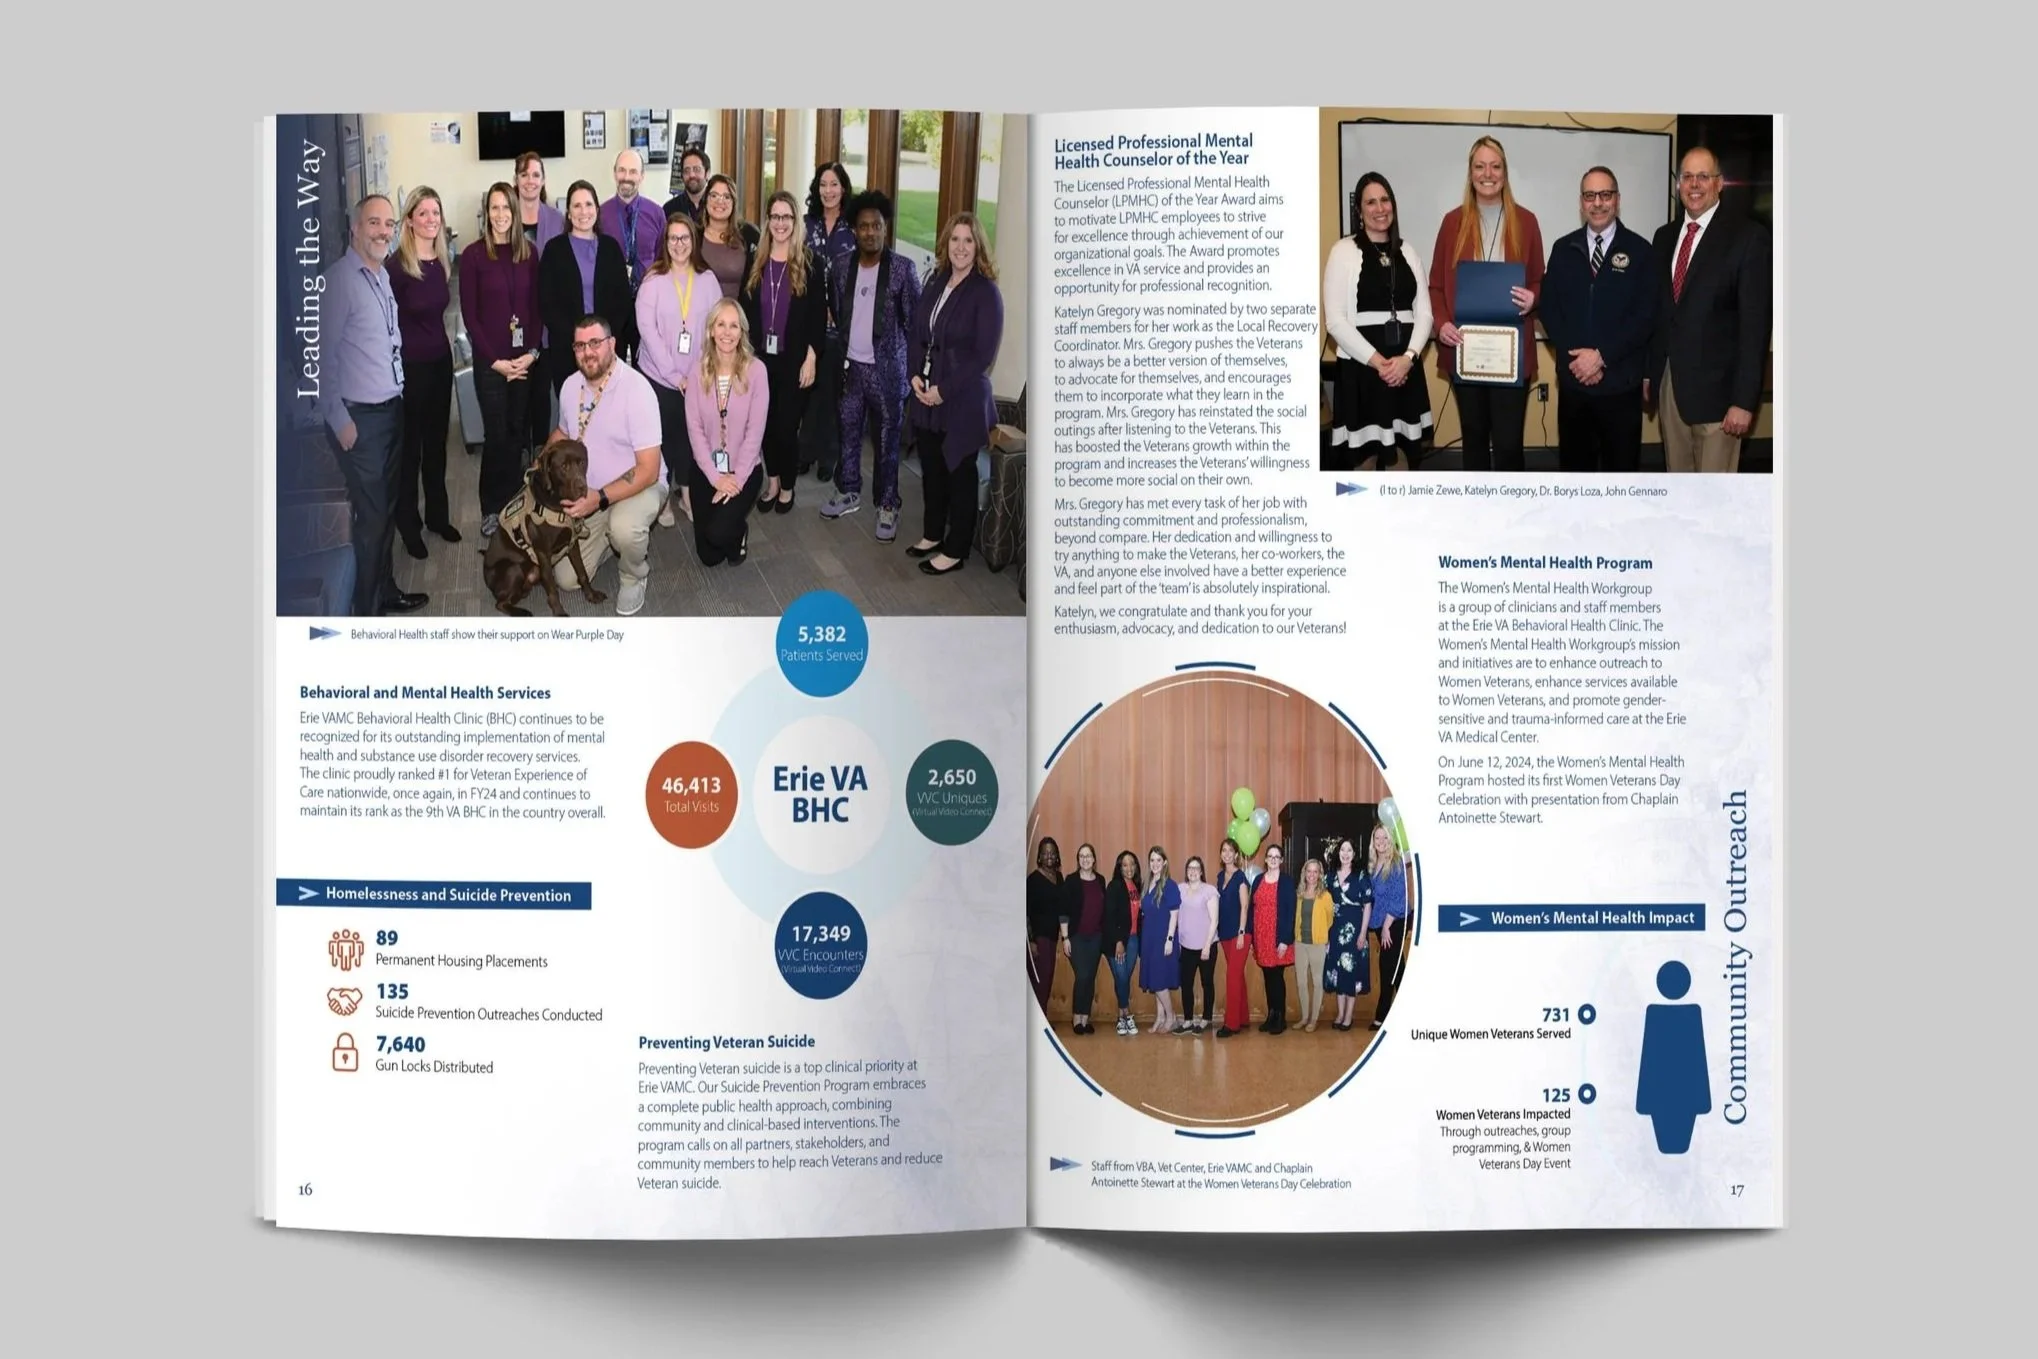
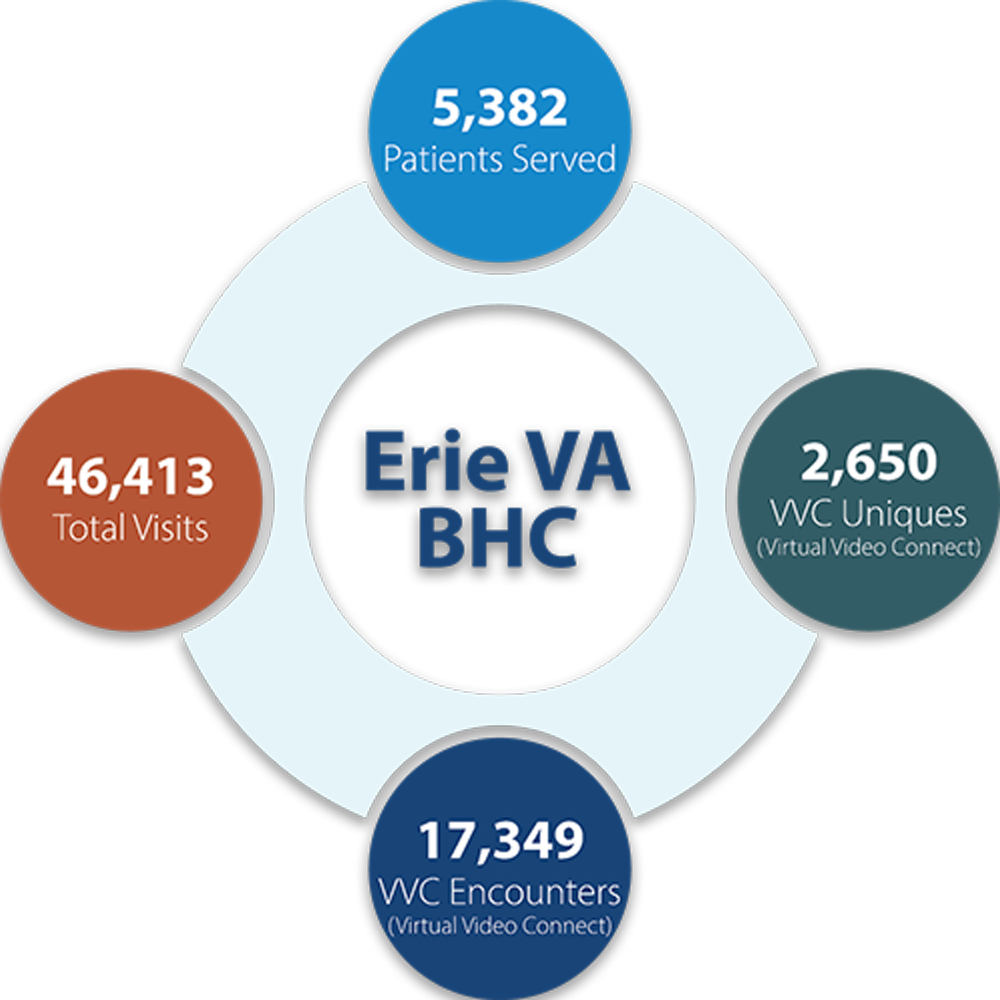
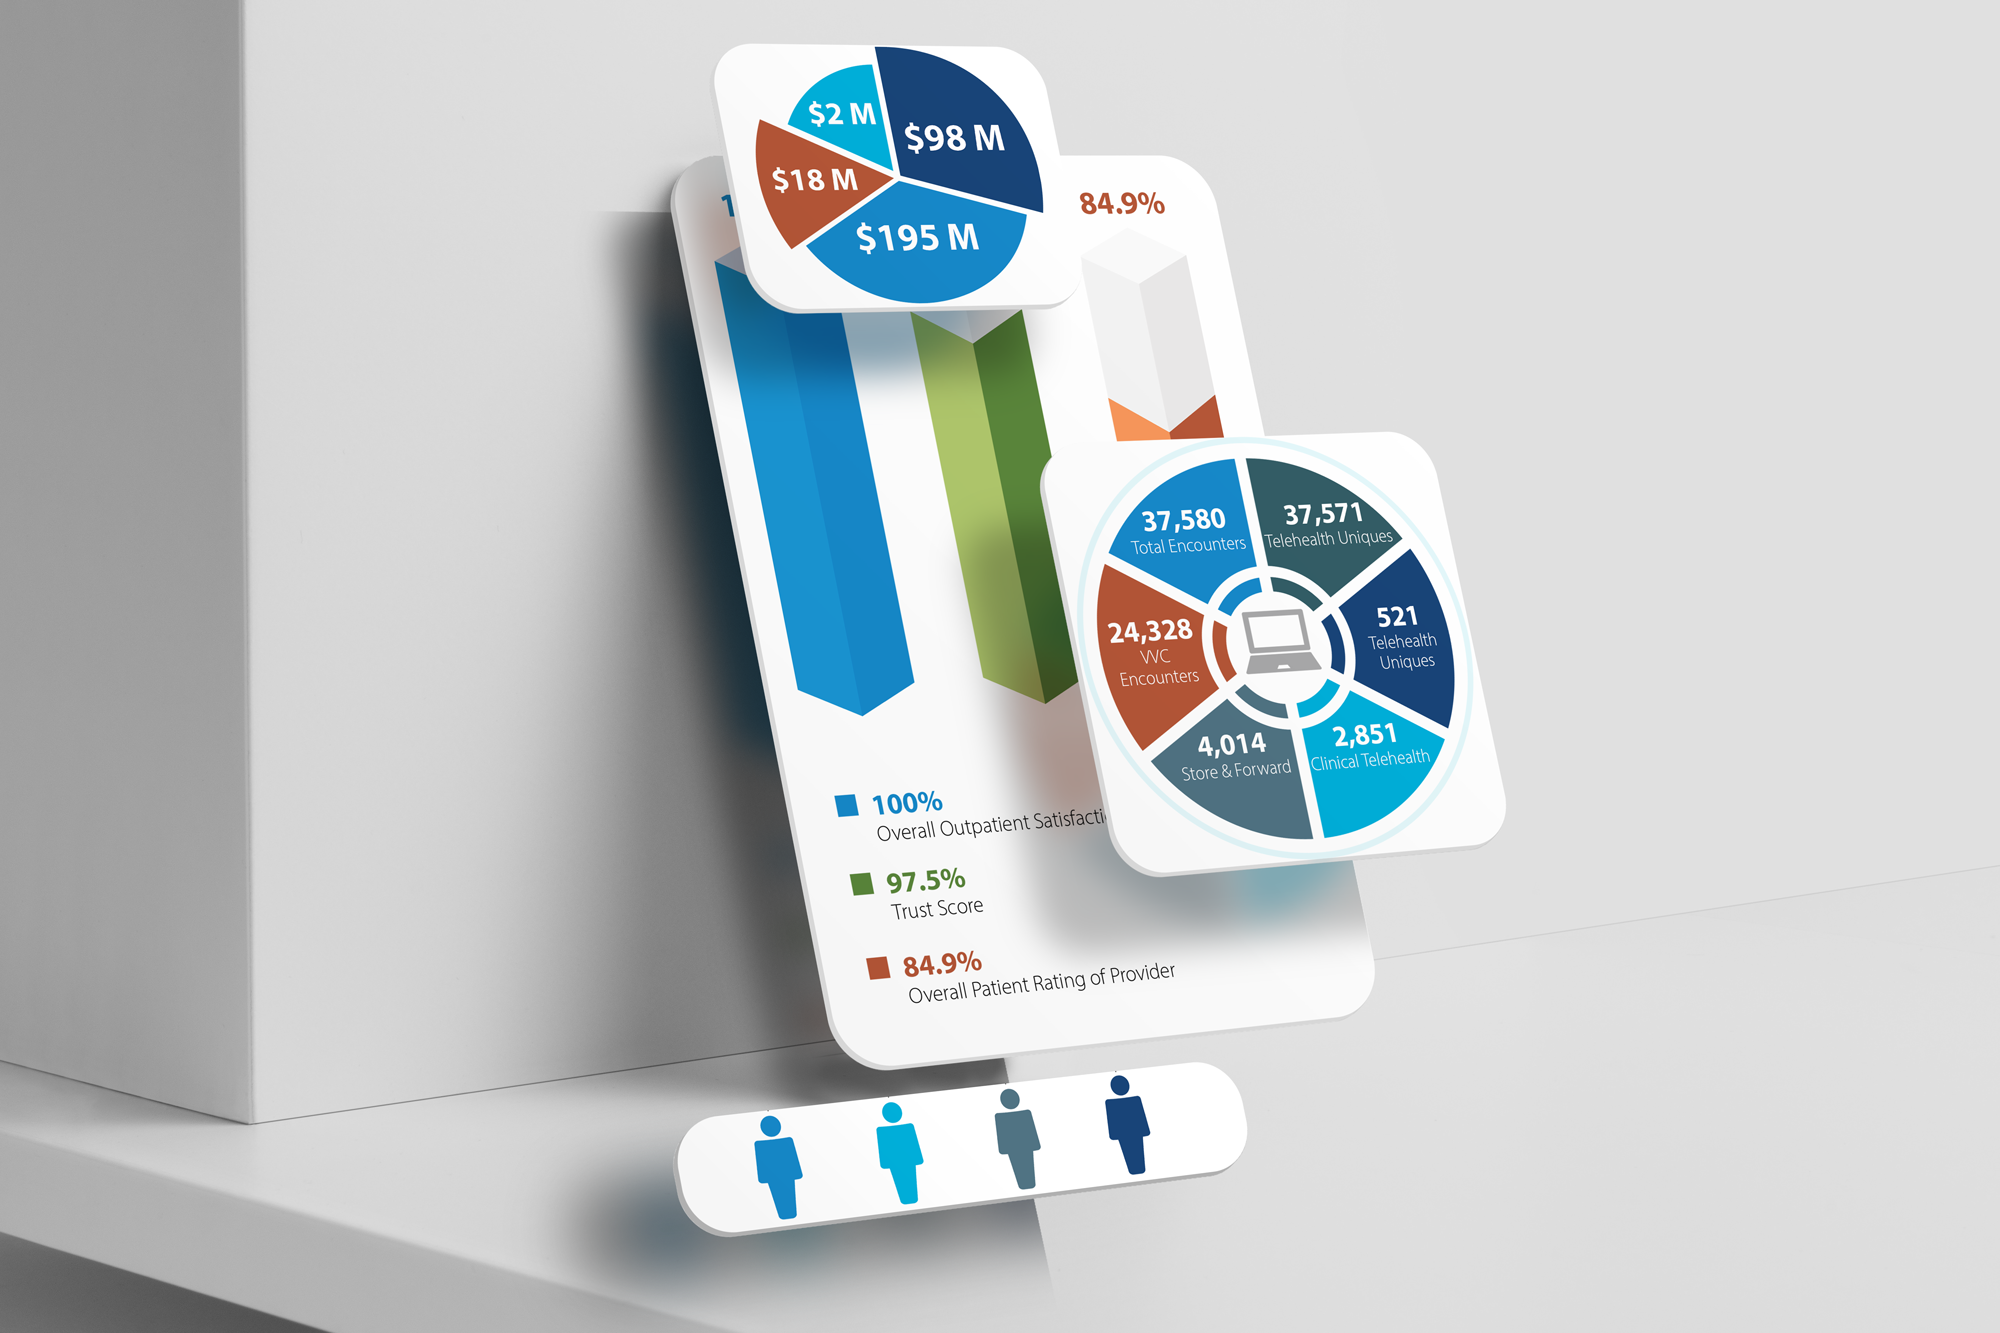
Department highlights for Erie VA Behavioral Health Clinic’s FY24 patient reach, telehealth encounters, and total visits.


Data highlight icons for Homelessness and Suicide Prevention programs.
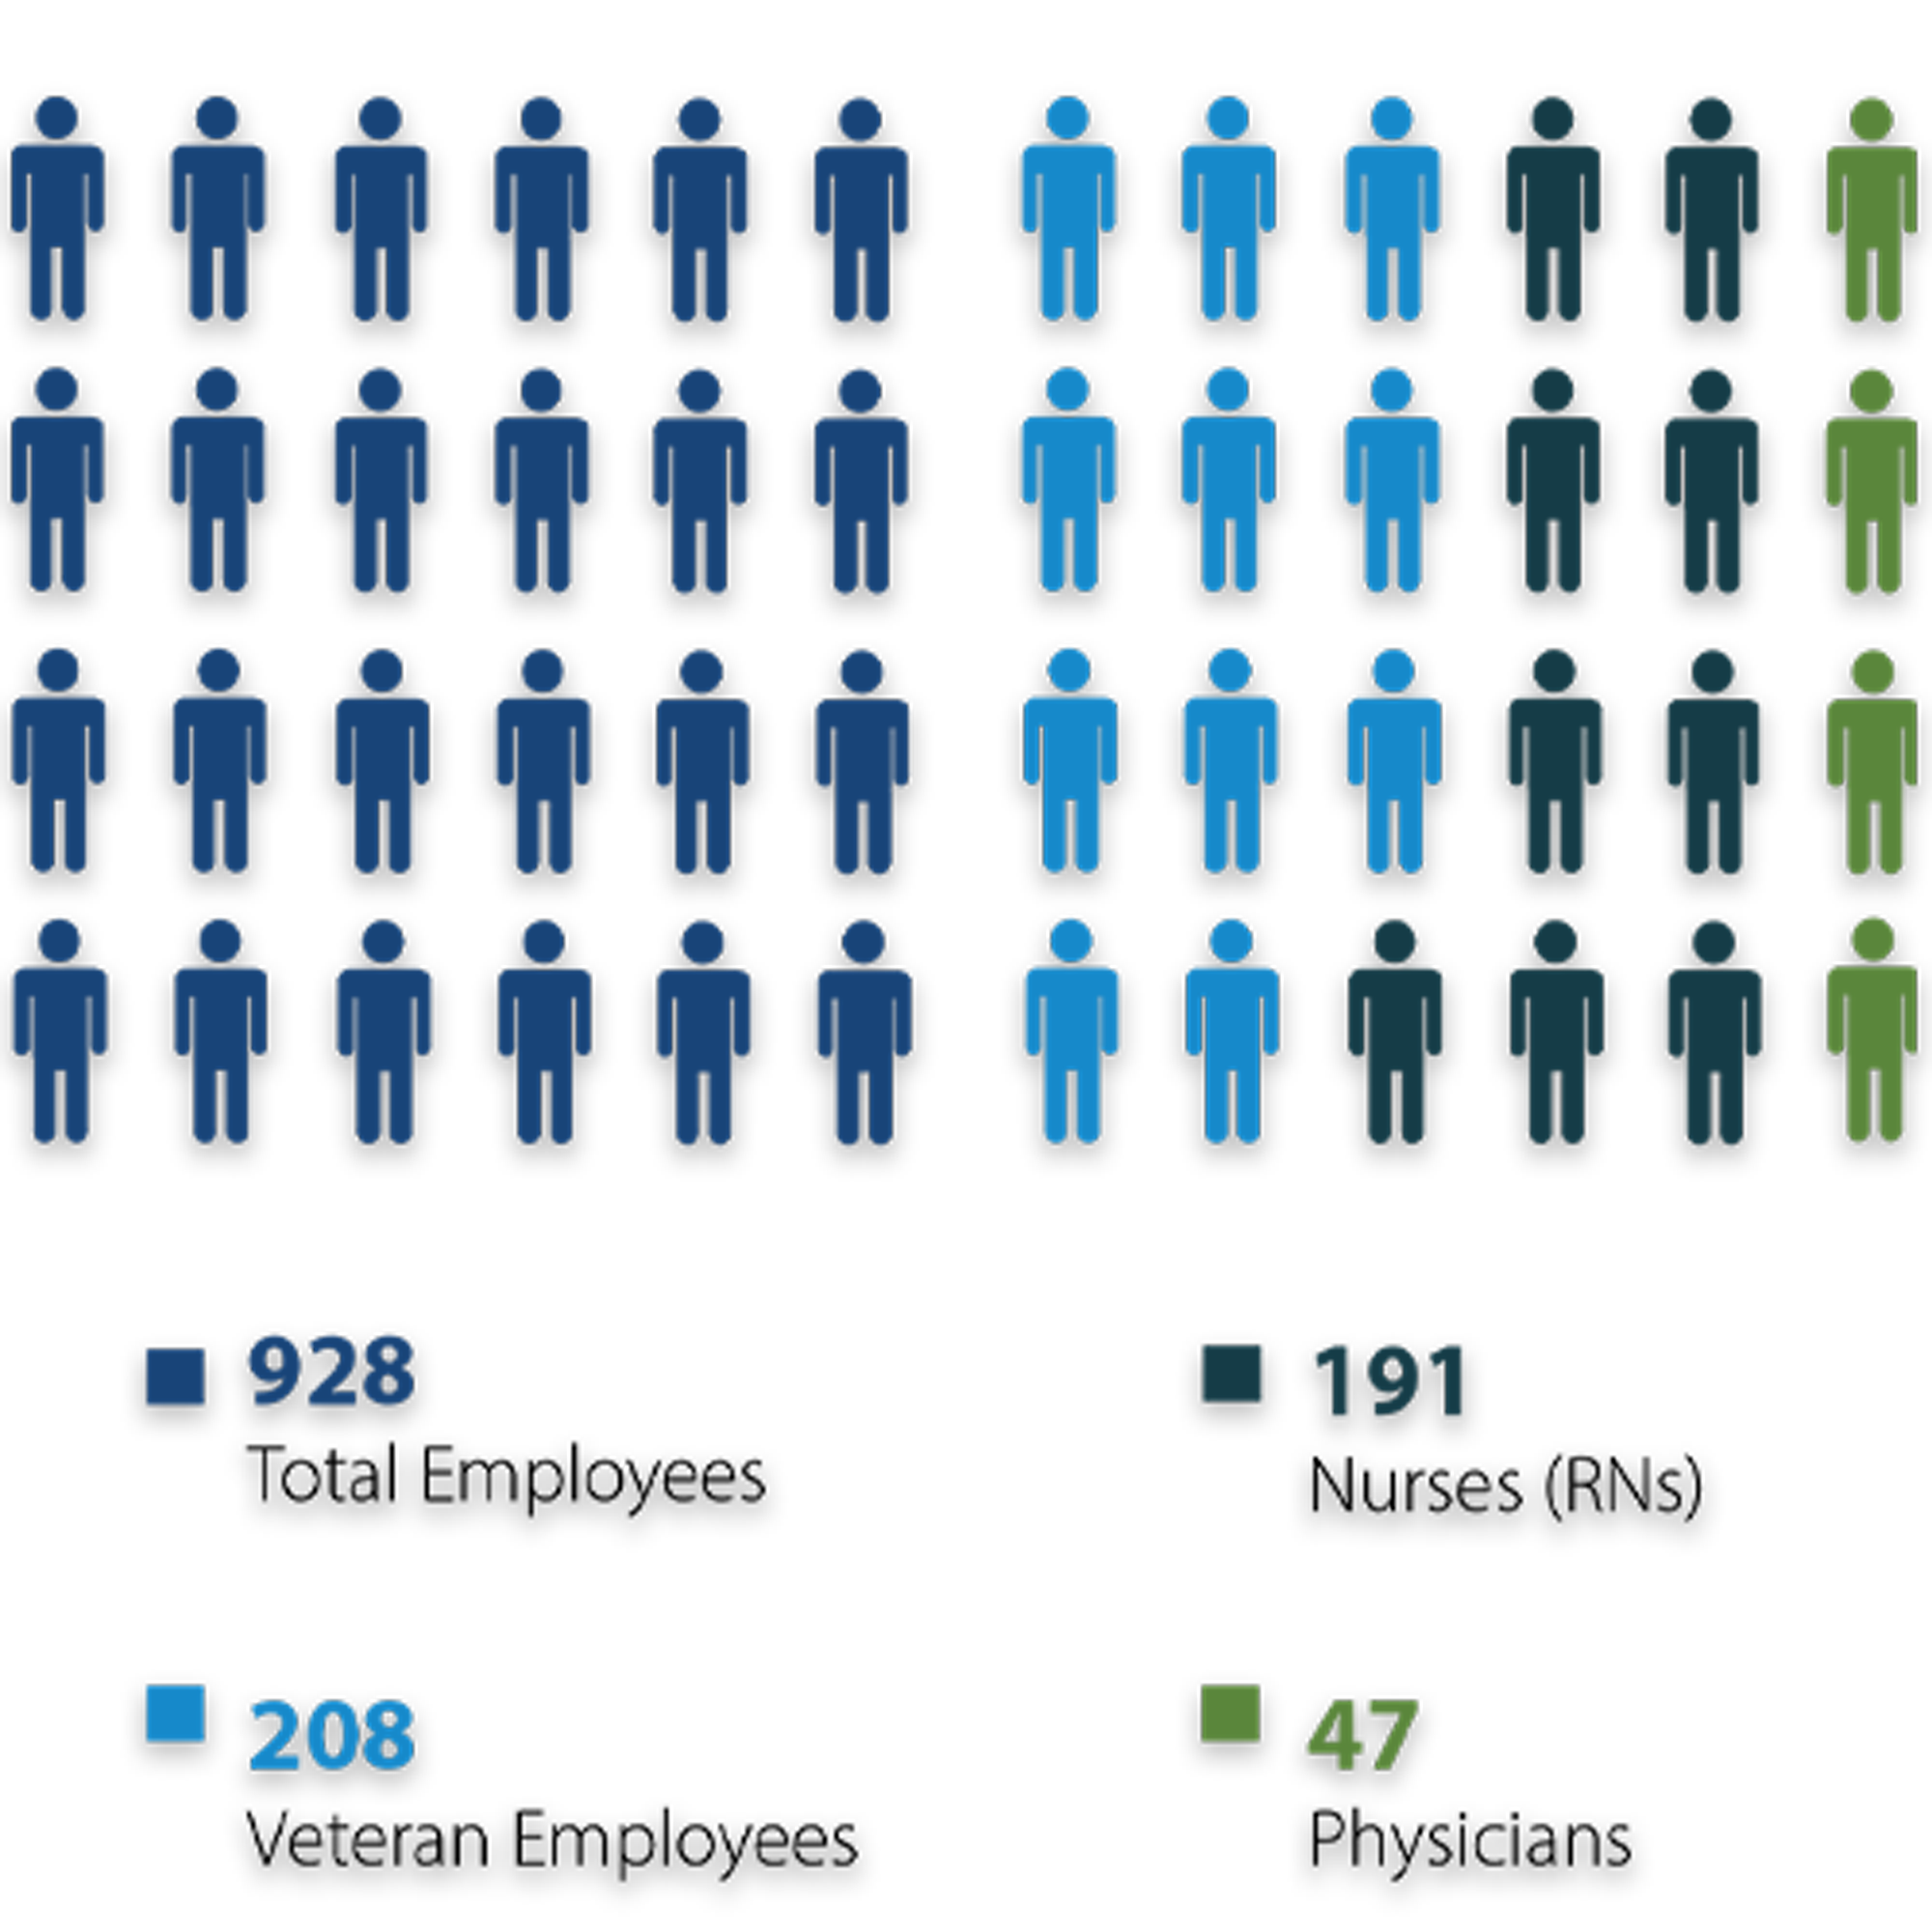
Facility highlights for employees and demographics.
Outcome
The FY24 Annual Report received positive feedback for its readability and professionalism. Stakeholders noted the clarity and effectiveness of the visual hierarchy, which allowed them to quickly grasp insights that were previously difficult to interpret. The streamlined visuals improved both usability and comprehension, supporting more informed discussions and presentations across the organization.
Reflection
This project reinforced my belief that strong data visualization is not just about displaying numbers, but about creating understanding through design. I learned to balance analytical accuracy with aesthetic clarity using hierarchy, typography, and visual pacing to guide attention without oversimplifying meaning.